Posted on January 26, 2023 by Jeff Lauder
This winter has certainly been one for the memory books, but what about the record books? With all of the rain we’ve received over the last few weeks, multiple questions have been coming up. Just how big is this storm compared to prior wet years? Is this a “drought buster”? What are the impacts, good or bad, to water quality or general health of the watershed?
Here at SSI we study watershed health, and we monitor during droughts, floods, and everything in between to understand how our regional waterways respond to extremes both now and in the projected future. As the climate warms, we can expect more extreme weather events like the ones we have been experiencing. This is because a warmer atmosphere holds more moisture, and a warming ocean and atmosphere can lead to dramatic shifts in general climatic dynamics such as type of precipitation (rain vs snow), timing of that precipitation, and where it falls. Remember; global warming is really “global weirding”! So let’s dive in to some of the major questions that come trickling down the stream during times of intense rain!
First: What is a watershed? A watershed is an area of land where, when it rains, all the water flows downhill to the same place. All the land that drains to Deer Creek is the Deer Creek Watershed. Deer Creek eventually flows into the Yuba River. All the land that drains to the Yuba River is the Yuba River Watershed, which includes the Deer Creek Watershed.
It is under the influence of rainstorm runoff events like we have been experiencing lately in California that rivers and streams can change the shape and structure of the channels in which they flow. Huge amounts of soil coming off the landscape create turbid flows of small suspended particles but these muddy flows can also move huge boulders and tear apart banks and rearrange channel form and habitat. At the Sierra Stream Institute we have been gathering data not only on water quality and chemistry, but also on the physical environment of streams – what’s on the bed, the depth and width of the channel, the riparian plant cover, and so we will be able to re-measure these things at the same sites we have been monitoring and be able to tell how these storms have affected the habitats of our watershed. What’s more, we also have sampled the bug community that lives in these streams and so will also be able to share how aquatic life has responded to these storm runoffs. Comparing our data from last year to this year will allow us to understand many aspects of how these increasingly frequent manifestations of climate change are altering the ecology of the rivers and streams where we also seek out our love of water. Climate whiplash from drought to flood has now become a common condition, and “normal” is now nothing more than a statistical average. The service we provide at SSI is to help the community understand the changing waterscape, and involve volunteers to help gather that information, know it in depth, and share it with others. We are here to answer questions. To give some perspective on what has been going on, we can use hydrographs (daily flows) of Deer Creek from the last year and the latest storms compared to the 2016-2017 water year when the Oroville Dam famously was nearly breached by record runoff in February of 2017, with date along the bottom of the graph and showing log-scale discharge of the creek in cubic feet per second on the lower part of the stream near Smartsville, and ask how big this storm event was relative to some of these bigger events on record.
How big is this storm/winter compared to previous water years?
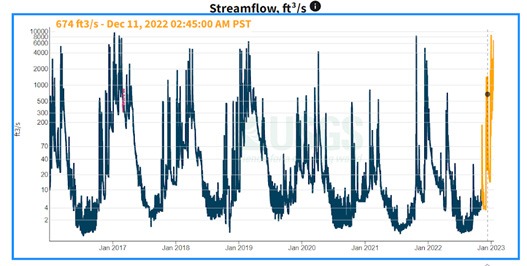
The figure above shows discharge in Deer Creek at the Smartsville gauge at Mooney Flat Rd., just above the confluence with the Yuba. Discharge is shown in cubic feet per second (cfs). So imagine a cube that is 1 foot on all sides, fill it with water, and at peak flow more than 8000 of those cubes have been flowing past the gauge per second this year! Compare that with summer last year when peak flow was less than 1 cubic foot!
Peak flows this year (so far) are higher than many recent years, but still not as high as Winter 2017. But what also stands out from this figure is the low flows from last summer and the summer before compared to summer 2017 and 2018; note how low the flows are in recent summers and how long they stay low, while they are more variable in years past. This is the impact of a cumulative drought on streamflow!
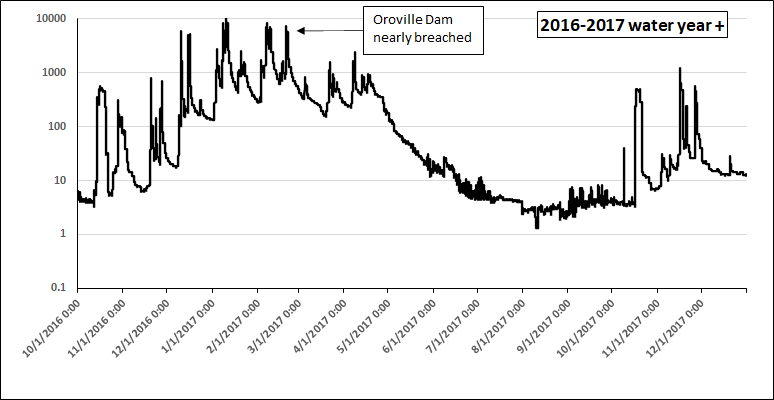
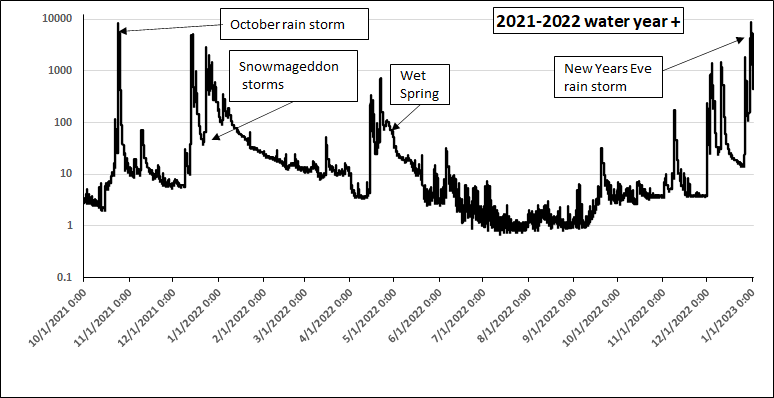
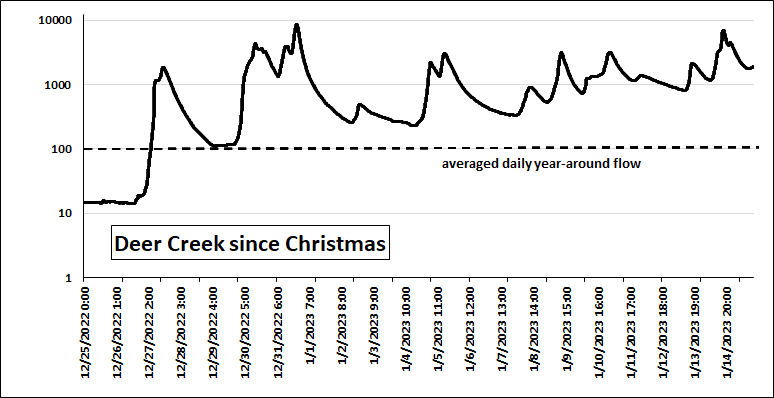
These sustained high flows are near the magnitude of the February 2017 storms and even the new years day storm of 1997 for those who may recall widespread damage, water pouring under the Hwy 49 bridge on the South Yuba, and that destroyed/closed highway 395 in Walker Canyon in the eastern Sierra (taking many months to repair).
Is “the drought” over?
In short…it depends! These storms definitely have an impact, but what we mean by “drought” can vary. Drought doesn’t just refer to how much water hits the ground; agricultural drought or droughts that affect our water use are often gauged by reservoir capacity at any given time (often cumulative over multiple years), while measures like snow water equivalent (SWE, or the amount of water stored in our snowpack) are good measures of how much water is available on the landscape. So lets look at all of these!
(California Department of Water Resources)
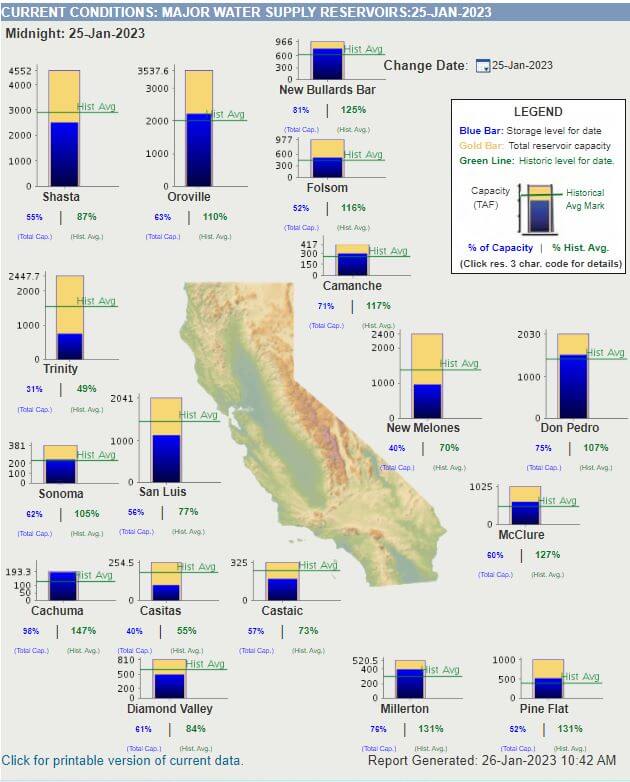
Many of our smaller reservoirs are already hitting or going above historical average capacity, but the big indicator our state uses for “drought severity” is related to the “big 3” reservoirs of Shasta, Oroville, and Trinity. This is because these three reservoirs alone provide the majority of water to the whole state!
Oroville, which has been at historically low levels in recent years, seems to be recovering to historical average, and this is before peak runoff season! Trinity, meanwhile, is still struggling.
So what about Snowpack?
(California Central Sierra Snow Lab [UC Berkeley])
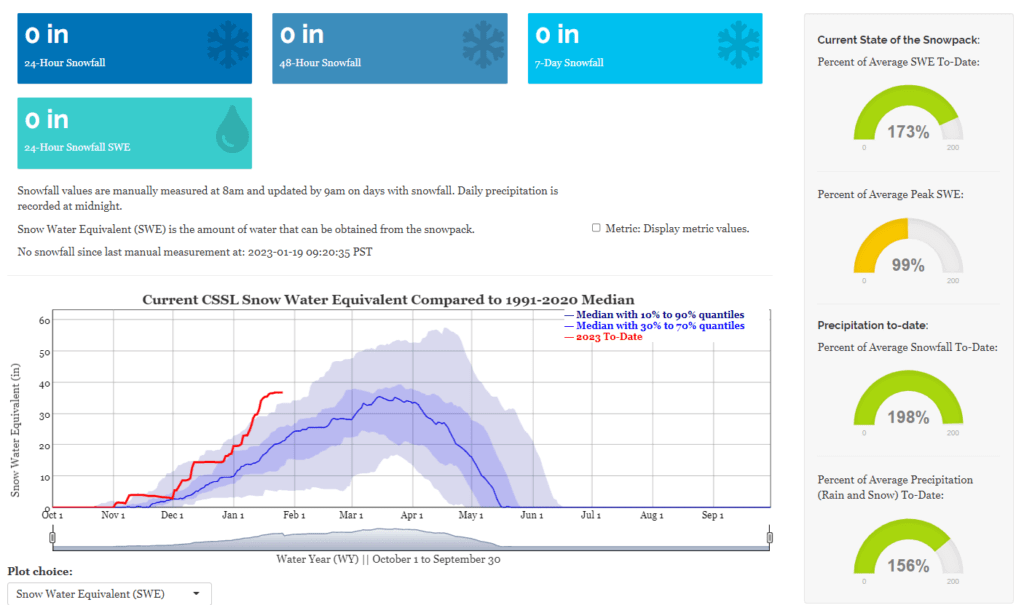
Looking pretty good! So what do these numbers mean? Percent of average SWE is amount of snow water equivalent received up to today’s exact calendar date relative to the average. So far this has been a wet early Winter! So why is percent of average peak SWE still <100%? Because peak snow water equivalent is typically found in Spring, with April 1st often the date of the thickest snowpack. So we are ahead of schedule!
So are we in a drought still or not?
How we determine whether our region is “experiencing drought” depends on, like we discussed above, how much snow there is, how much water is in that snow, how much runoff is captured in reservoirs, but also some factors that we can’t see, like how much water is stored in soils and groundwater storage. This is where “cumulative” drought can add up, as multiple years of low snowpack deplete groundwater reserves. This is why we don’t often just look at precipitation when measuring drought severity, but also things like temperature and evapotranspiration—or how much water is leaving the system through evaporation from the surface or transpiration from plants. This is because if we have two areas that receive the same amount of water, but one is hotter in the summer, then the hotter area will have higher evapotranspiration and less water available.
The US Drought Monitor takes each of these factors into account to approximate the severity of drought a region is facing at a regional scale. So what do they say about the current storm impacts on our multi-year severe drought?
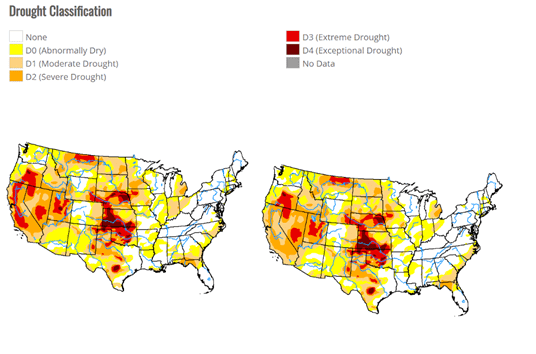
The image on the left was drought severity as of January 3rd of this year, while the image on the right is updated as of January 17th! That is how quickly a single storm system can impact drought severity. But also notice that we are still in moderate to severe drought in large portions of the state, as projected using things like temperature, groundwater storage, and how much we likely need to fully recover from multiple years of water drawdown.
But things are looking up!
What are the impacts (good or bad) on water quality?
Turbidity and conductivity: what are we measuring and what does it mean?
Turbidity refers to the amount of tiny stuff, like sediment, suspended in the water. We can’t see each individual grain of sediment with our naked eyes, but we can see the cloudy, “hot chocolate” result when there are a lot of them! This is similar to smoke in air; we can’t see each individual smoke particle, but we can see the haze that results when there is a lot of smoke.
Sediment in the water can stick in the gills of fish, settle on top of fish eggs and stunt growth, and even impair fish in their hunt for food. Filter-feeding invertebrates such as clams and water fleas can become clogged with sediments, and high levels of solid material in water can increase the temperature of the water, leading to lower oxygen levels. This has to do with both the ability of solids to heat up faster than water, and the ability of cold water to hold more oxygen than warm water (the molecules are moving faster in warm water and more dissolved gasses, like oxygen, can escape).
Conductivity measures the concentration of any charged particles present in water; this could be in the form of salts, nutrients like nitrates or phosphates, or any other ions. Conductivity may be related to the underlying geology of the stream bed, or result from urban runoff containing things like fertilizers. Generally it is easier for creek critters to live with lower conductivity, although it depends because conductivity can be such a wide variety of things, and organisms need some ions in small amounts.
Storm impacts
The impacts of high turbidity or conductivity on creek life are greatest when the water is chronically turbid or highly conductive, and are less extreme when the changes are episodic, as with storms. Turbidity tends to be high throughout a heavy storm due to continued erosion, while conductivity tends to be highest at the start of the rain and then dilute over time, similar to bacteria levels.
So a reasonable hypothesis regarding storm impacts would be a spike in turbidity as flows increase, especially with major storms. So did we see this?
First, let’s look at streamflow vs turbidity throughout all of Deer Creek using a dry year (2016) through the current event to see if turbidity (red dots) increases with flow.
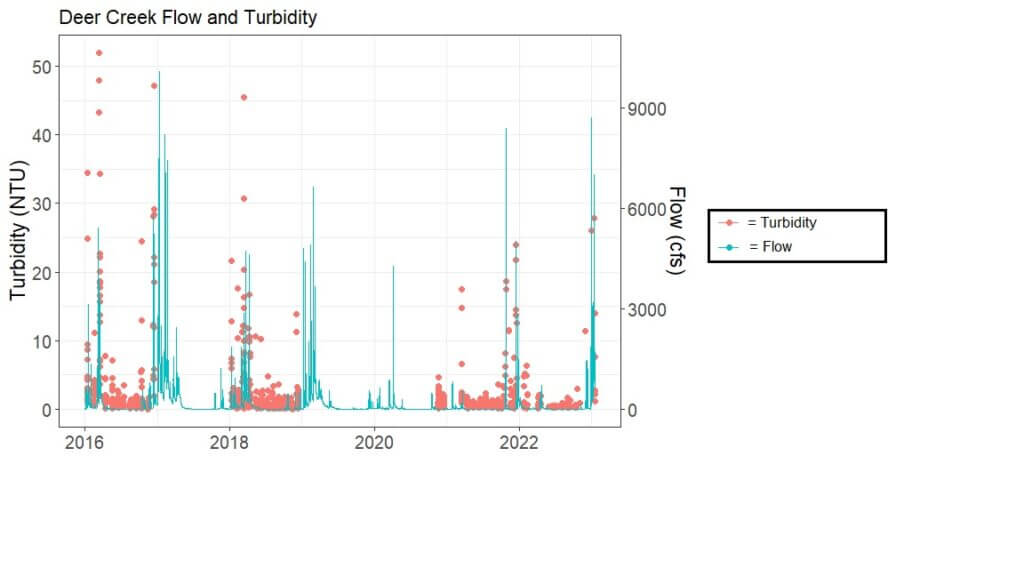
We see that, on average, yes turbidity increases as flows increase, which makes sense. We also see that our highest turbidity values are associated with high flows, but also note that not all high flows lead to equally high turbidity! For example, take a look at 2016, with a max turbidity value (NTU, or nephelometric turbidity units) of >50! This value was associated with a peak flow of only ~5200 cfs. Note that there are no regulatory thresholds for turbidity, but during “background” flows during the rest of the year, we typically see values as low as 0-0.5 and usually less than 5 NTU, so 50 is an order of magnitude more “stuff” in the water! Meanwhile, the major flows of 2017 (>9000 cfs) and this current storm event (>8500 cfs) both had lower turbidity measurements.
So what gives? Well, turbidity can be driven by flow, but also by things like non-natural erosion or inputs from humans. Further, a storm after an extreme drought (like 2012-2016) may have higher turbidity impacts than a storm after wet conditions (although we need more data to test this!). Finally, a series of storms may lead to a “flush” of particulates in early flows that are lower than the peak flow, with major floods then just moving water downstream but after all of the “stuff” has already been flushed out! We sample when we can during storm events, but may miss peak flow or flushing events, so we can’t say for certain whether we would have seen higher turbidity if we would have sampled just a day or even an hour before we did. This is why a robust volunteer monitoring team that can respond to these events is so important for good data!
Let’s take a closer look, now, at just this year’s storm vs flows and storm events in recent years to see if we can pick out any other patterns we’re missing when looking at multiple years.
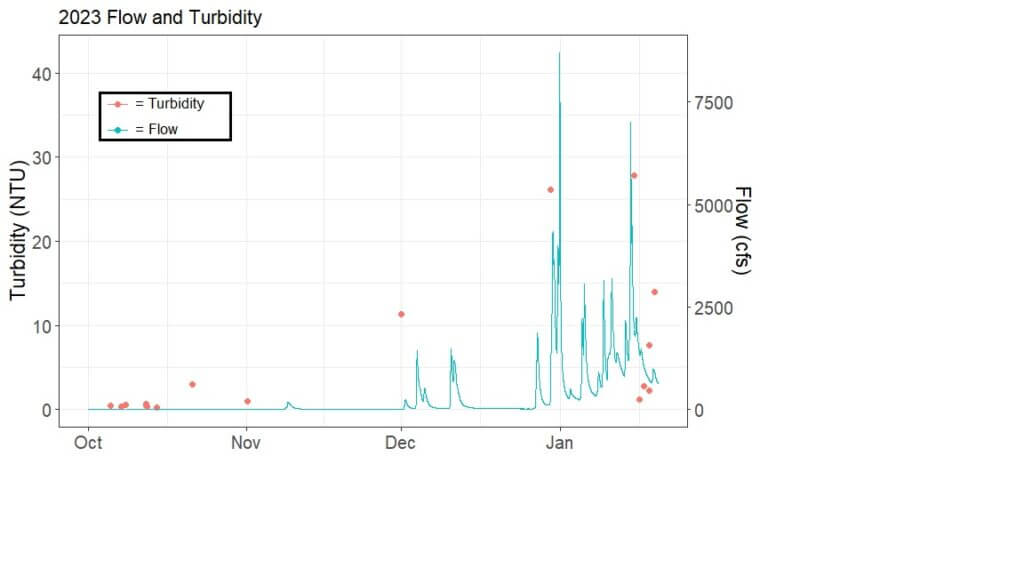
Take a look at how variable turbidity can be at a given flow by looking at the samples on the far right. After the main peak in flow, turbidity dropped fairly rapidly, showing how quickly this system may have “flushed out” Deer Creek! Also note that we sample multiple locations throughout Deer Creek, and flow is measured at one location regularly, so flow upstream may be very different than downstream.
So what about how this storm and its impact on turbidity compare to the rest of the year and years past?
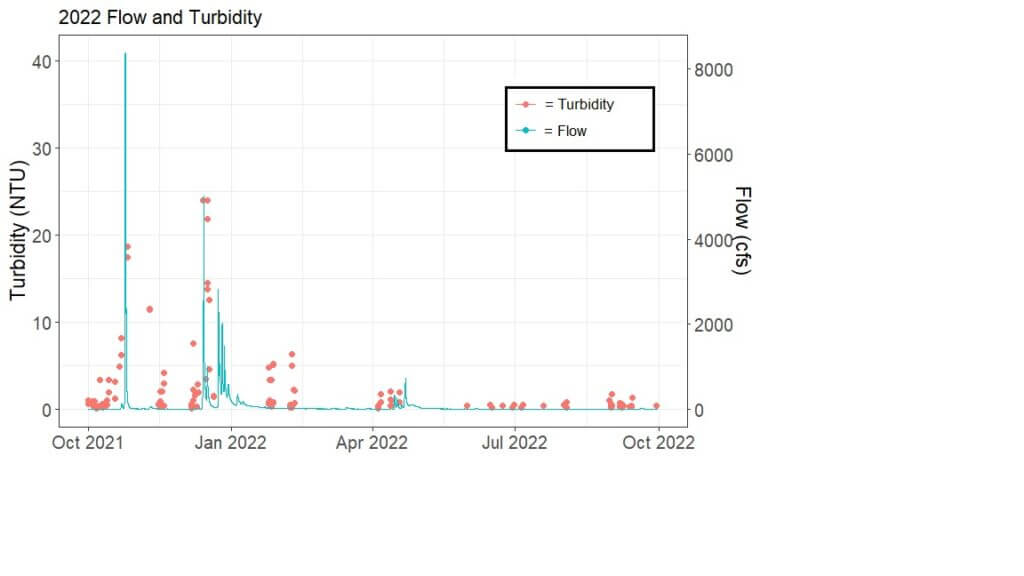
Here we see that we actually had higher turbidity in the current storm (previous figure) than we had in similar flows in late 2021 (remember that massive October rainstorm?!). This again may be because of the timing of the storm relative to other “flush” flows, or other controls on turbidity we aren’t accounting for here.
So what about again looking at this storm—and now its turbidity impacts—compared to the massive 2017 water year or the end of the “mega drought” in 2016?
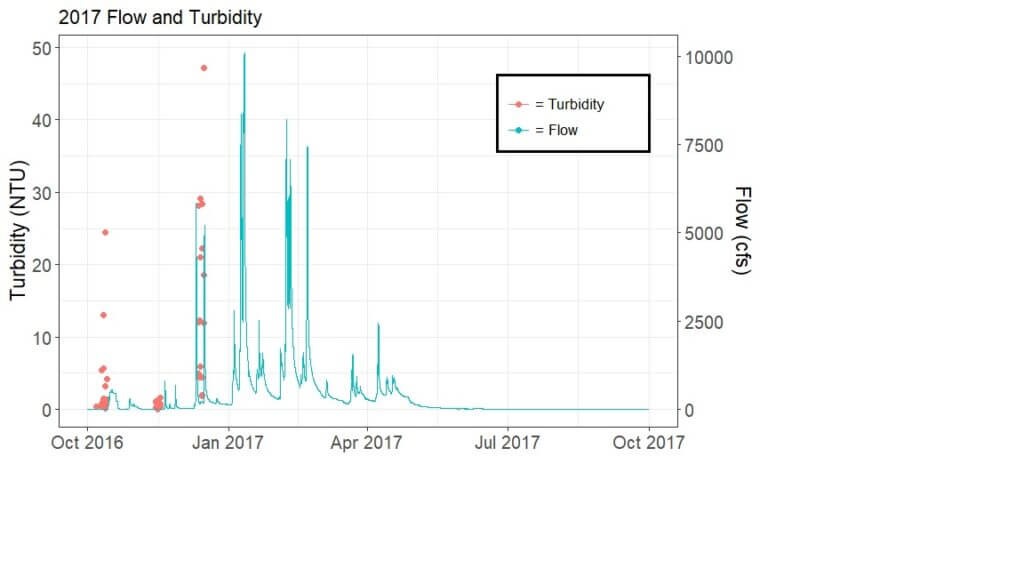
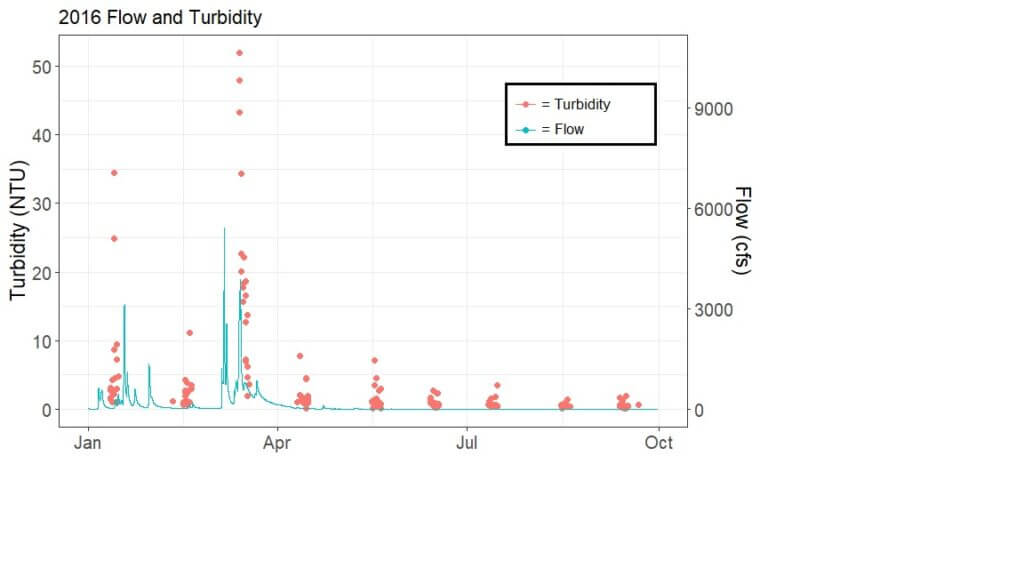
Again, take a look at the massive turbidity measurements in 2016, but with lower flows than 2017 or 2022! So what’s going on here? There could be any number of things; timing of our sample collection, more erosion in a big storm after a drought, or some combination of these! Only more monitoring and analysis will allow us to fully pull apart this relationship!
So were these storms “good” or “bad” for water quality in Deer Creek?
Storm impacts on water quality vary, and can be “good” or “bad” depending entirely on your perspective. When we think of big storms, we often think of what’s shown in the news; flooding in neighborhoods and damage to infrastructure. But what about the water itself? Is a “flush” good for the system?
Typically, we expect stormwater flows to be higher in contaminants like the bacteria E. coli than non-storm flows, at least at the start of the season. This is because we expect increased erosion or inputs of contaminated surface water into the streams, because it hasn’t rained in months and contaminants have built up on roads and fields. But after some of this “first flush” with higher levels of contaminants, we tend to see a dilution effect as the large amount of water reduces the relative concentration of the contaminants.
But what about the biology?
What are the impacts (good or bad) on in-stream ecology?
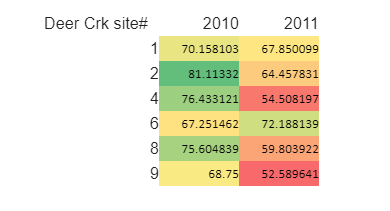
Here at SSI we also sample and identify Benthic Macroinvertebrates (BMI), aquatic insects that respond in various ways to changes in water quality and habitat. We can often use these insect communities to tell us about how significant events like drought and flood impact stream biology. So how do these bugs respond to big flood years? We are currently working through samples collected over the last year, and will collect new samples this Spring to see how this storm “reset” the system by clearing everything out, but we can use samples collected in the past to see how similar water years impacted the community. For example, prior to 2017, 2011 was the one of the wettest winters on record, so what if we compare 2010 and 2011 samples to see if big water years do indeed reset the system? In this case, we will use %EPT, or percentage of Ephemeroptera (Mayflies), Plectoptera (Stoneflies), and Trichoptera (Caddisflies) as these are important “indicator” taxa, with more of these insects being a sign of a healthy system.



From left to right: example Ephemeropteran, Plectopteran, and Trichopteran.
So after the big 2011 winter, many of our sites were “depleted” of these indicator taxa! We may expect to see this again this year, but only samples taken in June will tell us for sure!
How do we know what we know, and when/how can we collect more data?
We have teams of volunteers who monitor the creeks at different times, including quarterly “baseline” monitoring, teams who go out during storms, and teams who go out during the hot, dry, low-flow times in the summer. By putting all of this data together over time, we can start to understand how the creek behaves “normally” as well as how it may respond to very wet and very dry conditions. Only through “baseline monitoring” can we establish the true impacts of disturbances like drought or floods, both of which are expected to increase in frequency and intensity under climate change. We then pair this data with other long-term datasets that are available like climate, tree cores, and streamflow to build a complete picture of how our watersheds respond to dramatic shifts. So come join our team of dedicated volunteers and help us continue to keep tabs on the impacts of climate change on our watershed and the Northern Sierra Nevada in general by becoming a citizen scientist!
So let us return to our original question: this winter has certainly been one for the memory books, but what about the record books? Just how big is this storm compared to prior wet years? Is this a “drought buster”? The answer is essentially: its in the data, it seems like its a pretty solid winter so far, and as always, it depends!
We hope this primer gave you a closer look at what went on during this extreme weather event, which can be expected to become more common under increasing climatic warming. But come explore all these questions and more at this upcoming SciPub with Sierra Streams Institute on Tuesday January 31st from 6-7 PM at the Gold Vibe Kombuchary! Please arrive a couple minutes early to grab your drinks!

